
What Is Occupancy Rate in Box Office? The Complete Guide
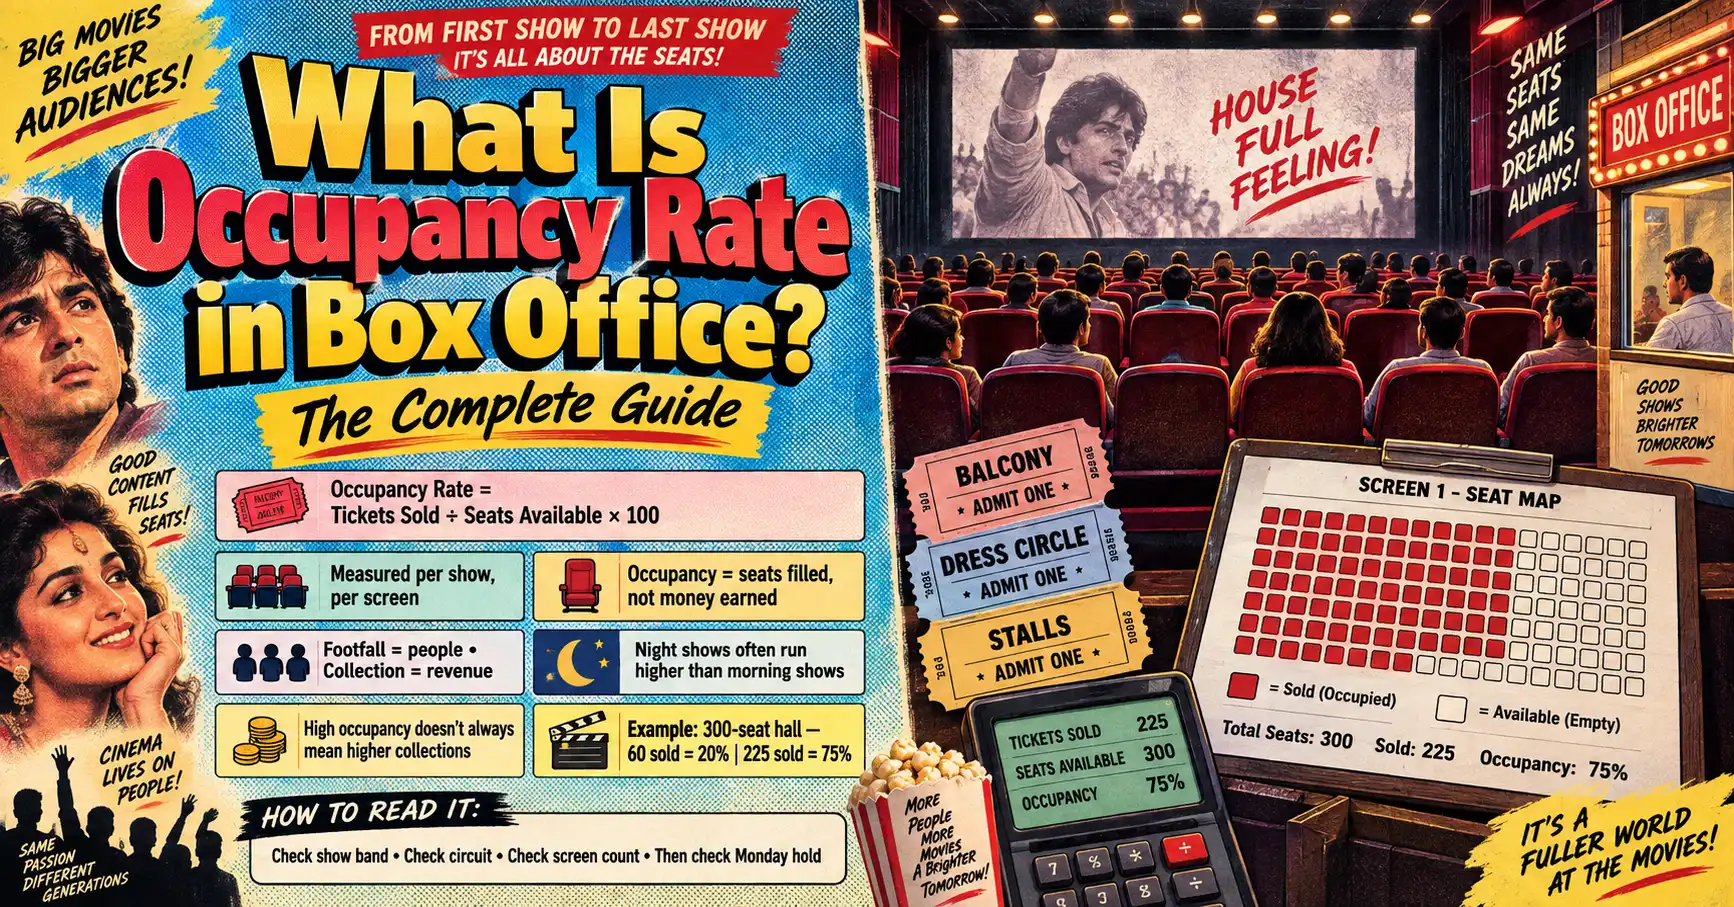
Open any Day 1 box office report and you’ll trip over a line like this: “morning shows 25%, night shows 75%.” Nobody stops to explain it. So what is occupancy rate in box office reporting?
It’s the share of seats a show actually sold, written as a percentage. Seats filled, divided by seats available. Done.
The definition takes five seconds. Reading the number properly takes longer, and that’s where most fans slip. A film can post 80% occupancy and still lose money. Another can crawl along at 25% and quietly print cash. Both happen, and the reasons are boringly mechanical.
What Is Occupancy Rate in Box Office Reports? The One-Line Answer
Occupancy rate = tickets sold ÷ total available seats × 100. Per show. Per screen.
Hotels use the same metric for rooms. Airlines use it for seats. Cinema just borrowed it and pointed it at auditoriums.
Two words carry all the weight here: per show. Occupancy isn’t a daily average that drops out of the sky at midnight. Trackers build it show by show, hall by hall, then roll the numbers up into the morning, afternoon, evening and night bands you see quoted.
Miss that and the percentage means almost nothing.
The Occupancy Rate Formula, With Real Seat Math
Put a real hall behind the formula and it stops feeling abstract. Take a 300-seat multiplex auditorium, a fairly ordinary size.
- 60 tickets sold → 20% occupancy. Sixty humans, 240 empty seats. Looks bleak on camera, and it is.
- 76 tickets sold → 25.3% occupancy. That’s roughly where PVR INOX, India’s largest multiplex chain, landed company-wide in Q1 FY27, up 330 basis points year-on-year from about 22%.
- 225 tickets sold → 75% occupancy. Night-show territory on a genuinely big opening day.
Same hall. Same formula. Wildly different stories.
Why the denominator decides everything
Here’s the part people skip. Occupancy compares a film against capacity, not against other films.
Imagine two shows that each sold 150 tickets. One played a 200-seat screen and posts 75%. The other played a 1,000-seat screen and posts 15%. Identical audience. Identical ticket count. One headline screams houseful, the other screams disaster.
That single quirk explains most of the arguments you see on X after a Friday release.
Occupancy is a snapshot, not a scoreboard
A 9 AM show and a 10 PM show on the same screen can differ by 50 percentage points. Averaging them into one tidy “Day 1 occupancy” number hides the whole plot. Good trackers publish the bands separately for exactly that reason.
Why Occupancy Jumps From the Morning Show to the Night Show
Night shows win. Almost always. And the gap is bigger than most readers expect.
The cleanest recent illustration came from Karuppu, the Tamil release that opened in May 2026. Its Day 1 occupancy climbed straight through the day: 25% in the morning, 46% in the afternoon, 53% in the evening, 75% at night. The Telugu dubbed version averaged 28% across the same day.
Why the climb? People work. People go to school. A 9:30 AM Friday show competes with everyone’s actual life, while a 10 PM show competes with nothing.
So a 25% morning figure on opening day isn’t a red flag by itself. It’s just Friday morning. The number you actually want is the night band, and then the Monday hold.
Read show bands in this order:
- Night shows on Day 1 tell you hype and advance booking strength.
- Afternoon shows across the weekend tell you word of mouth.
- Monday morning tells you whether anyone still cares.
That third one separates a real hit from a loud opening.
Occupancy Rate vs Footfall vs Collection
Three numbers get mashed together in every comment section. They’re not the same thing, and treating them as interchangeable is how bad takes get born.
- Occupancy = percentage of seats filled, per show.
- Footfall = the raw headcount of admissions.
- Collection = rupees earned.
They move independently because ticket prices refuse to sit still. A recliner seat in a Mumbai premium multiplex and a balcony ticket at a small-town single screen both count as one admission. They don’t contribute anything like the same revenue.
Picture two shows. A 250-seat single screen sells out completely at low ticket prices. A 500-seat premium auditorium fills half its seats at four times the rate. The single screen reports 100% occupancy, the multiplex reports 50%, and the multiplex still banks more money. Neither number lied. They just answer different questions.
Trade analysts run into this constantly. Sacnilk walked through a day that looked like 60–70% occupancy across circuits and projected around ₹25 crore gross, roughly ₹21 to ₹21.5 crore net. The reported net landed at ₹20 crore. Bulk and corporate bookings, plus plain reporting gaps, open that kind of hole regularly.
If the rupee side of the equation is what you’re really chasing, our breakdown of how box office collection is calculated in India covers the nett versus gross mess that sits underneath every tracker’s number.
What Counts as a Good Occupancy Rate in India?
Now the question everyone actually arrives with. There’s no single magic threshold, but the working ranges are well established.
For a mainstream release on a weekday, occupancy above roughly 30–35% reads as healthy. The 15–25% band that gets reported across Indian metro multiplexes on soft weekdays points to weak organic demand, and often sits at or below exhibitor break-even. In that 300-seat hall, 20% occupancy means about 60 people watching. Not a crowd. A gathering.
Weekend numbers naturally run higher, which is why comparing a Saturday night figure against a Wednesday afternoon figure proves nothing at all.
Don’t compare a film against a chain average
Here’s a trap worth flagging. PVR INOX’s 25.3% is a company-wide quarterly average. It bundles every show of every film across a full quarter, including dead Tuesday matinees for films in week six.
A blockbuster’s opening-night 75% is not “three times better than PVR INOX.” Different measurement, different time frame, different purpose. One describes a business. The other describes a moment.
Single screen vs multiplex
India runs roughly 6,500 single screens against about 3,700 multiplex screens, and fans compare the two formats endlessly. That comparison mostly misfires. Format isn’t what moves the percentage — the seat count of the specific auditorium is. Park the same 150 ticket buyers in a small hall and then a large one, and you get two very different headlines from one identical crowd.
Neither format is being dishonest. The maths just behaves differently.
North vs South
Southern circuits carry a reputation for stronger, steadier occupancy, and the structural data backs the direction of that reputation even without a clean head-to-head statistic. Regional cinema outside Hindi and English grew from 27% of India’s gross box office in FY24 to 31% in FY25. PVR INOX runs about 33% of its screens in the South against 38% in the North, and it’s pointing 40–45% of new screen additions southward.
Chains don’t build screens where seats stay empty. If you want a sense of the scale involved, look at the highest grossing South Indian movies of 2026.
Who Actually Reports Occupancy Data, and Who Slips Through
Three sources feed everything you read.
Exhibitors themselves. PVR INOX publishes occupancy as a standard quarterly KPI for investors. The chain runs 1,774 screens across 356 properties in 112 cities in India and Sri Lanka, so its number carries real weight. This is also the rare case where you can check an occupancy figure against the chain’s own published quarterly results.
Independent trade trackers. Koimoi and Sacnilk publish per-film, per-show percentages, built from online booking platforms plus circuit-level contacts. That’s where the morning/afternoon/evening/night grid in your X timeline comes from.
Estimates, for everyone else. And this is the honest limitation of the whole system.
India had roughly 10,200 cinema screens in 2025, and the single screens in that count largely sell over the counter, not through the online platforms analysts scrape. So the majority of India’s screens contribute the fuzziest occupancy data, and trade estimates fill the gap.
The base keeps shrinking too. Screen density slid from 7.6 screens per million people in 2018 to 6.8 in 2024, and 16,350 of India’s 19,000 postal zones have no cinema screen at all. National occupancy therefore describes an increasingly metro-clustered sample, not the whole country.
Keep that in your head the next time someone quotes a precise all-India occupancy percentage to two decimal places.
How Occupancy Feeds Into Hit, Flop and Blockbuster Verdicts
No trade body publishes a rule saying “45% occupancy equals Hit.” The verdict ladder works qualitatively.
Bollywood Hungama’s annual report card sorts releases into All-Time Blockbuster, Blockbuster, Super Hit, Hit, Semi-Hit, Average, Flop and Disaster. Its criteria mix sustained footfalls, cost control and word of mouth. The middle “Average” tier gets described through moderate collections paired with average occupancy, which tells you occupancy sits inside the judgement rather than deciding it alone.
Those same criteria point to one pattern: steady occupancy beats explosive occupancy. Sustained footfalls through the weekdays of week one signal a more durable hit than a Friday-night spike that collapses by Tuesday. Front-loading flatters the opening and wrecks the run.
Curious where this year’s Hindi releases finally landed in rupee terms? Our list of highest-grossing Bollywood movies of 2026 carries the lifetime collection totals — the end result that a long, steady run builds toward.
How to Read Any Occupancy Report in 30 Seconds
By now, what is occupancy rate in box office reporting should be the easy half of the question. Reading one fast is the actual skill.
Next time a Day 1 post lands, run this:
- Check the show band, not the headline. Morning, afternoon, evening and night tell four different stories.
- Ask which circuits. All-India, Hindi belt, Tamil Nadu, or one chain? They’re not interchangeable.
- Ask how many screens. High occupancy on 400 screens is a totally different result from high occupancy on 4,000.
- Separate the dub. Original-language and dubbed versions report separately, as Karuppu‘s 75% night band and its 28% Telugu average showed.
- Wait for Monday. Weekend occupancy flatters everyone.
- Never convert occupancy to rupees in your head. Ticket prices won’t cooperate.
Want to see the whole vocabulary working live? Our day-wise trackers, like the Jana Nayagan Day 6 collection report, put occupancy bands, screen counts and nett figures side by side in the exact format these numbers get published in.
So Is Occupancy Rate Paisa Vasool or Time Waste?
Paisa vasool, with one condition attached.
Occupancy is the most honest number in a box office report, because seats can’t be spun. Rupee figures pass through pricing decisions, corporate booking deals, gross-versus-nett conversions and a fair amount of PR. A 75% night band means 75% of those chairs had people in them. That’s a fact about the world.
It’s also incomplete on its own, and anyone quoting occupancy without screen count, circuit and show band is selling you a headline rather than a result.
Bookmark this one. Then go check the next Day 1 report properly: night band first, Monday hold second, and only then pick a fight in the comments.